
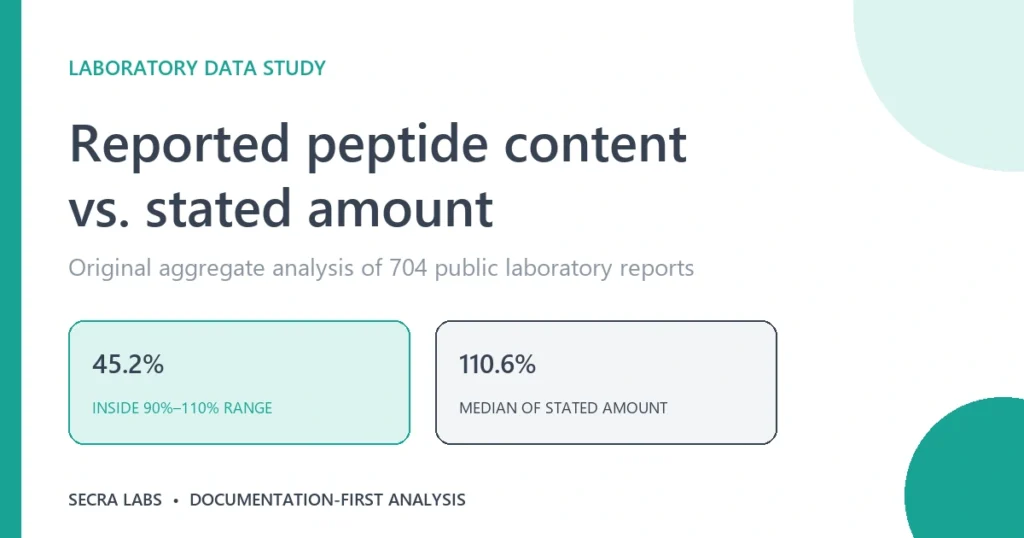
Across 704 public peptide lab reports, the median reported content was 110.6% of the amount stated in each report. A total of 318 reports (45.2%) fell within a descriptive 90%–110% comparison range, 16 (2.3%) fell below it, and 370 (52.6%) fell above it. This range is not a pass/fail standard.
Secra Labs did not test these samples again or inspect their physical labels. We compared two fields in each report: its Net Content (mg) value and the clear milligram amount in its product description. The results do not prove the true fill, rank a supplier, or explain why any one result differed.
Key findings
- The middle reported peptide content result was 110.6% of the stated amount.
- The median gap from the stated amount was 11.0 percentage points.
- The middle half of results ran from 103.5% to 118.3% of the stated amount.
- 45.2% were inside the descriptive 90%–110% range.
- Higher peptide purity did not mean the reported amount was closer to the stated amount in this sample.
How close were the reported peptide amounts to the stated amount?
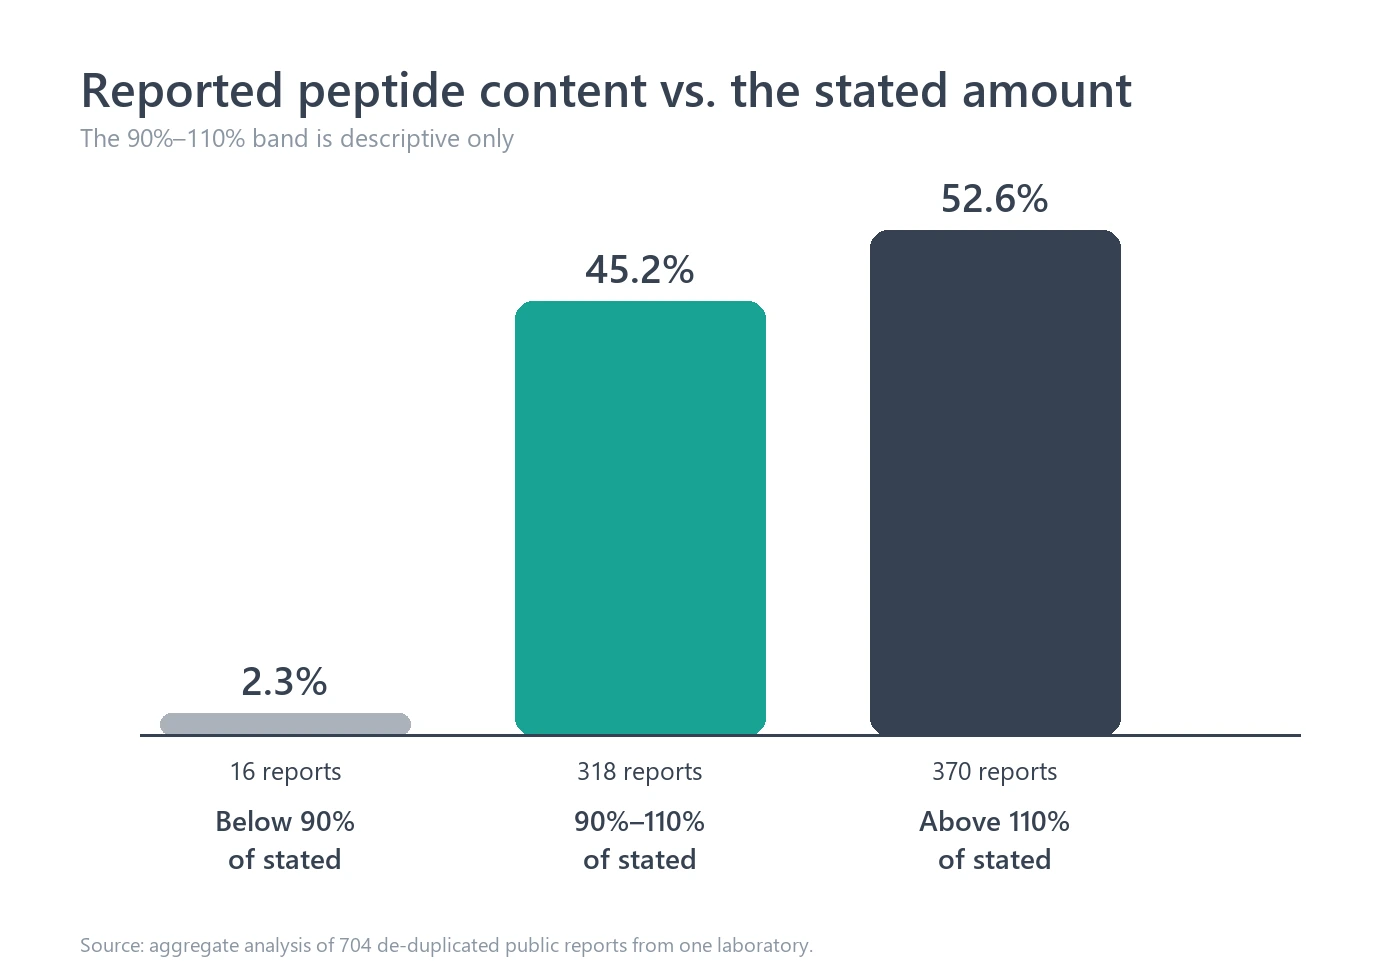
The 704 peptide COAs were not centered on exactly 100% of the stated amount. Their middle result was 110.6%. In other words, half of the reports were below 110.6% and half were above it.
| Reported content as a share of stated amount | Reports | Share of 704 reports |
|---|---|---|
| Below 90% | 16 | 2.3% |
| 90% through 110% | 318 | 45.2% |
| Above 110% | 370 | 52.6% |
The study uses the 90%–110% range only as a descriptive guide. It makes the spread easy to see. It is not an official limit, a contract term, or a peptide pass/fail rule.
The middle 50% of reports ran from 103.5% to 118.3% of the stated amount. The full extracted range was 25.7% to 207.8%. Those end points show what appeared in the dataset; they do not explain the cause or confirm the true amount in either report.
We also looked at the size of each gap. We ignored whether a result was above or below 100% and measured only its distance from 100%. The median distance was 11.0 percentage points.
What does percent of the stated amount mean?
The source reports used many stated amounts. A raw difference of one milligram would not mean the same thing for a report that stated 5 mg and one that stated 50 mg. We made the reports comparable with this calculation:
reported content ÷ stated amount × 100
For a simple example, imagine a peptide report with a stated amount of 10 mg and reported content of 11 mg. The result would be 110% of the stated amount. This is only an example; it is not one of the study records.
On this page, stated amount means the clear milligram value in the report's product description. It does not mean Secra inspected the package or confirmed a physical label. Reported content means the value in the field labeled Net Content (mg).
A result above 100% is not always better. A result below 100% does not by itself prove a product problem. Each number still depends on the sample, test method, and way the lab reported the result.
What these results can and cannot tell us
The figures answer a narrow question: How did the content value in each public peptide COA compare with the amount stated in that same report?
They show the shape of that comparison across 704 reports. They also let us test whether peptide purity moved with the content result.
They do not show:
- the true amount in any product;
- whether a supplier or lab was accurate;
- whether any report passed an outside standard;
- why a result was above or below the stated amount;
- how the full peptide market performs; or
- material suitability, safety, efficacy, or outcomes.
Both values came from finished public reports. This was an analysis of documents, not an independent laboratory test.
What peptide COAs were included?
The source file held 1,467 public lab reports from one searchable archive. The reports were received from April 17 through June 15, 2026, and reported through June 17, 2026.
For the main study, a report had to describe one peptide, confirm identity, state one clear amount, and give number results for purity and content. We also required an ok extraction status.
How 1,467 reports became 704
The rules were applied in order. Each excluded report appears only once.
| Sample step | Reports removed or retained |
|---|---|
| Reports in the source file | 1,467 |
Extractor status was partial or error |
426 removed |
| Duplicate report number | 15 removed |
| Numeric purity or content was missing | 178 removed |
| Identity was not confirmed | 1 removed |
| Not reported as lyophilized material | 6 removed |
| Known non-peptide material | 16 removed |
| Blend or multi-analyte report | 55 removed |
| Stated amount was missing or unclear | 66 removed |
| Reports in the main study | 704 retained |
The 426 extraction-status exclusions were not failed peptide tests. They described how a local data tool handled the documents:
- 37 were download errors tied to missing PDF links.
- 389 were marked
partialbecause the tool did not fully extract every target field. - 60 of those partial records still held all fields needed for this study.
We kept the strict 704-report set as the primary analysis. We then used the 60 usable partial records in a separate check.
The 704-report set covered 52 reported identities and 19 stated amounts. We do not name or rank peptides, suppliers, clients, or individual reports.
Did a larger sample change the result?
The result was much the same when we added the 60 usable partial records. The larger check held 764 reports. Its median was 110.4% of the stated amount, its median gap was 10.9 points, and 45.9% fell inside the same descriptive range.
| Comparison | Reports | Median as % of stated | Median absolute difference | Inside 90%–110% |
|---|---|---|---|---|
| Strict primary sample | 704 | 110.6% | 11.0 points | 45.2% |
| Add usable partial extractions | 764 | 110.4% | 10.9 points | 45.9% |
The close match suggests the strict status rule did not create the main pattern. It does not remove the broader limits of using one public archive.
Did higher peptide purity mean a closer amount?
No clear link appeared in this sample. The rank-based link score between peptide purity and reported content was 0.003. A score near zero means the two results did not rise or fall together in a clear pattern.
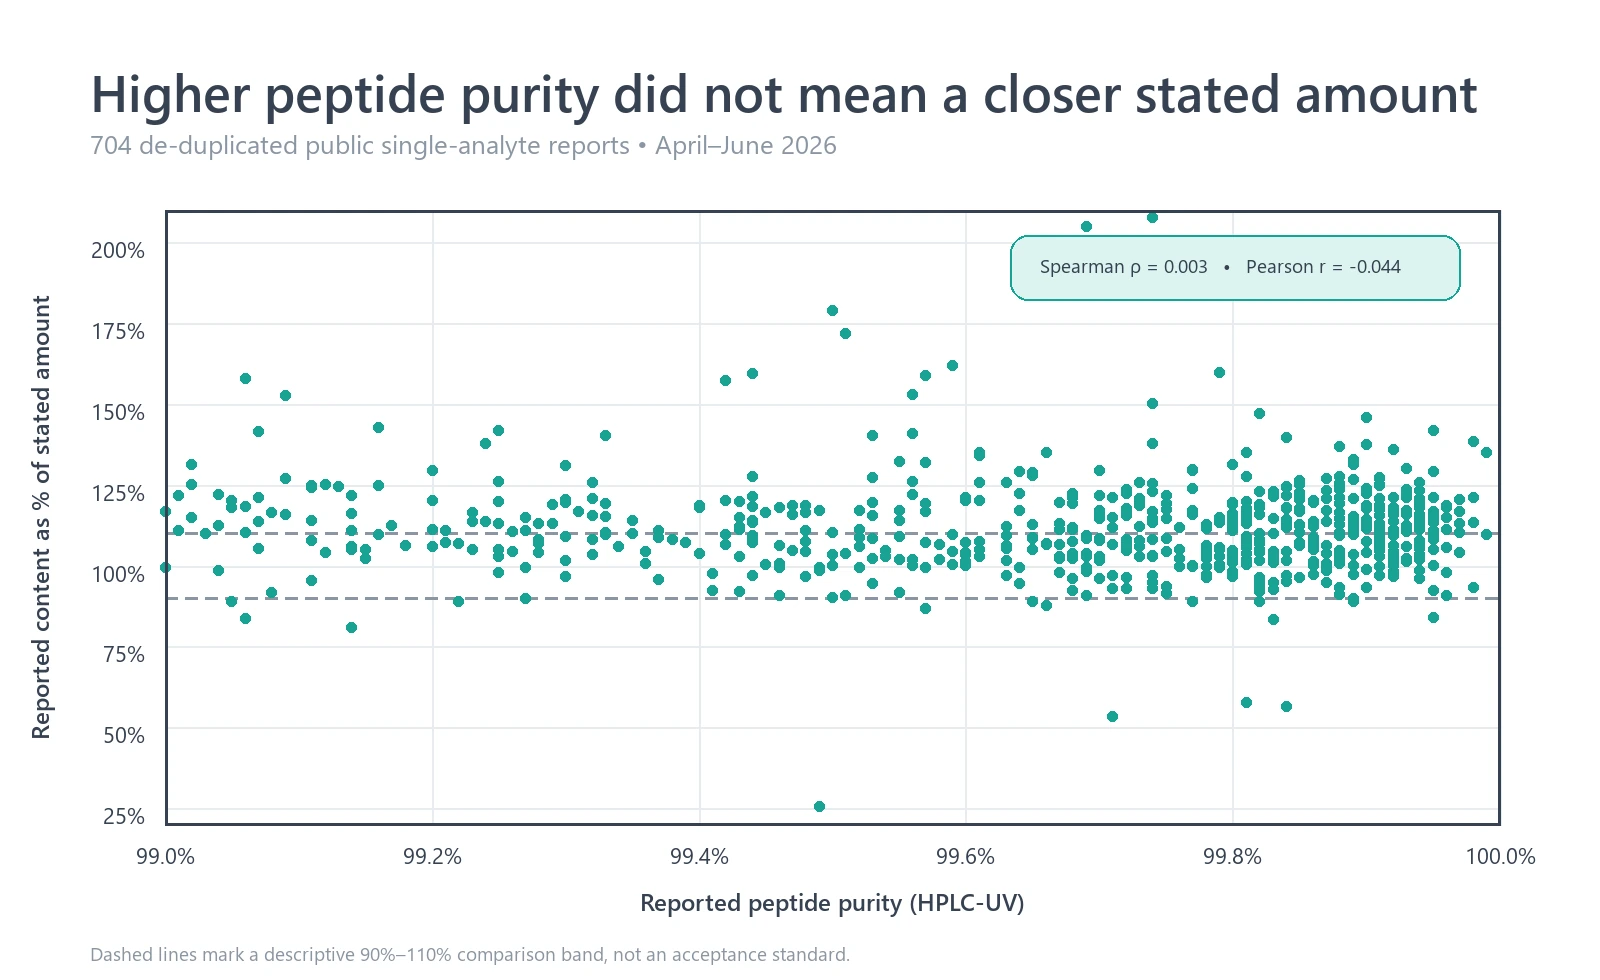
We also tested whether higher purity meant a smaller absolute difference from the stated amount. That result was -0.019, also close to zero.
This does not prove that purity and amount can never be related. Every primary report had a purity result from 99.00% to 99.99%. That narrow range limits what this dataset can show. The 95% resampling range for the main rank result ran from -0.070 to 0.074, which also supports no clear pattern here.
Why purity and reported amount can differ
Peptide purity and reported content answer different questions.
In these reports, purity was the share of detected HPLC-UV peak area assigned to the main peptide peak. It describes the peak pattern found by that test. It does not directly state how many milligrams were present.
Reported content was a separate amount result in milligrams. HPLC can be used for an amount test when the method is built and checked for that purpose, but an area-purity percentage should not be converted into milligrams.
Several factors could affect a reported amount, such as method setup, calibration, sample make-up, water, salts, solvents, and reporting precision. This study did not have enough public method detail to tell which factor, if any, explains an individual result.
This distinction is consistent with ICH guidance on analytical procedures and a USP peptide reference-standard study. Both treat purity and amount as separate analytical questions.
How to review reported peptide content on a COA
A peptide certificate of analysis is easier to read when each field is given one job.
1. Find the stated amount
Look for the amount in the product description or sample name. Note the value and unit. Do not assume it came from a label unless the report says so.
2. Find the separate content or assay result
Look for a numeric amount with a unit such as milligrams. Check how the lab names the field and whether the method is described.
3. Compare like with like
Make sure the stated amount and reported content use the same unit. If you calculate a percentage, divide the reported amount by the stated amount and multiply by 100.
4. Read identity and purity on their own terms
Identity supports what the sample was reported to be. Purity describes a purity result. Neither should be used as a shortcut for the reported milligrams.
5. Match the document details
Check that the report number, lot or sample reference, dates, lab, identity, purity, and content all refer to the same submitted sample.
6. Look for limits and missing details
Ask whether the report explains the method, units, uncertainty, and any stated specification. Do not create a pass/fail rule that the report itself does not give.
Keep it simple. Check the name, lot, unit, and test. Make sure each field points to the same sample. If a key fact is not clear, ask for the full report.
Secra Labs publishes available lot-specific peptide COAs for direct review. You can also read about our documentation-first approach or contact Secra Labs with a question about an available report.
Study limits
- One lab: the reports came from one public archive, not the whole peptide market.
- Short period: the source reports covered about two months in 2026.
- Not a random sample: public reports may differ from reports that were not posted.
- No new tests: Secra analyzed finished reports and did not retest the materials.
- No physical-label review: the denominator came from each report's product description.
- Limited method detail: public documents did not allow every content method to be fully compared.
- Narrow purity range: all primary purity results were between 99.00% and 99.99%.
- No cause finding: the study did not determine why any one result differed.
- No ranking: the results cannot rank a peptide, supplier, client, or lab.
- Not peer reviewed: this is an original, repeatable analysis of public documents.
Frequently asked questions
How close was reported peptide content to the labeled amount?
We did not inspect physical labels. Compared with the amount stated in each report's product description, the median was 110.6%. A total of 45.2% fell inside the study's descriptive 90%–110% range, 2.3% fell below it, and 52.6% fell above it.
What does reported peptide content mean on a COA?
In this article, reported peptide content means the value in the report field labeled Net Content (mg). It is separate from the purity percentage. A different COA may use a different field name, so always read the method and units.
Is 90%–110% an official peptide pass/fail standard?
No. This study uses that range only to describe the distribution. It is not presented as an official, regulatory, or contractual standard.
What does reported content above 100% mean?
It means the report's content value was above the amount stated in that report's product description. It does not, by itself, explain the reason, prove the true fill, or show that the result is better.
Does 99% peptide purity mean 99% of the stated amount is present?
No. Purity and content are separate results. In this dataset, purity stayed from 99.00% to 99.99%, while reported content covered a much wider range.
Why might reported peptide content differ from the stated amount?
Possible factors include test setup, calibration, sample make-up, water, salts, solvents, and reporting precision. The public reports did not provide enough detail for this study to assign a cause to any result.
Why were 426 reports excluded from the main study?
Their data-extraction status was partial or error. That was a document-processing issue, not a failed peptide test. A separate 764-report check added the 60 partial records that still had every field needed for the analysis.
Can this study compare peptide suppliers or named products?
No. It was designed to compare two reported fields in aggregate. It does not independently verify products or support supplier, product, client, or laboratory rankings.
Study method and sources
The full local methodology records the source scope, order-dependent filters, field rules, formula, statistics, sensitivity checks, privacy steps, and reproducible scripts. Row-level report numbers and source files remain outside the public package.
Primary references:
- ICH Q2(R2): Validation of Analytical Procedures
- FDA: Q2(R2) Validation of Analytical Procedures
- Development of USP peptide reference standards
- Recommendations for peptide measurement
- Interlaboratory study of peptide quantification
Data-source disclosure: This study uses aggregate fields extracted from publicly searchable reports in the Freedom Diagnostics archive. It does not reproduce report images, client names, report numbers, lot identifiers, or row-level records. Publication remains subject to source/data-use review.
Editorial notice: This article concerns peptide testing documents for laboratory research. It does not assess material suitability, safety, efficacy, or outcomes.